How a Mid Sized Publisher Doubled Ad Revenue Without More Traffic (Case Study)
An illustrative case study walking through how a mid sized publisher increased ad revenue by fixing fill rate, viewability, and remnant inventory, without growing traffic.
This case study is an illustrative, composite scenario built from patterns commonly seen across mid sized publishers, rather than a single named site, and is intended to walk through a realistic sequence of changes and their typical impact.
Growing traffic is the default answer most publishers reach for when revenue plateaus. But a meaningful share of the publishers who go through a full monetization audit find that a large portion of the gap wasn't a traffic problem at all, it was in how existing traffic was being monetized. This case study walks through a realistic scenario of that kind of turnaround, month by month.
Starting Point
The publisher in this scenario ran a content site with roughly 400,000 monthly pageviews, steady but not growing quickly. Their monetization setup was fairly typical for a site at that stage: a single primary display network, a static waterfall for whatever that network didn't fill, and no dedicated handling for remnant inventory beyond the same fallback list.
Initial audit findings were common ones:
- Blended fill rate sat around 55%, with remnant specific fill rate closer to 30%
- Several ad units were positioned below typical scroll depth, with viewability well under industry benchmarks
- Price floors had been set once, roughly a year earlier, and never revisited
Month 1: Placement and Configuration Fixes
The first round of changes focused on the fastest, lowest effort fixes: repositioning the lowest viewability ad units, adjusting overly aggressive price floors based on actual bid data rather than the original estimate, and loosening a latency timeout that had been dropping valid but slightly slower bids.
These changes alone produced a modest but immediate lift, a common pattern, since configuration issues tend to be quick to fix but limited in overall revenue impact compared to structural gaps.
Month 2: Adding a Dedicated Remnant Layer
The larger shift came from addressing remnant inventory directly. Rather than continuing to route unfilled primary impressions through the same static fallback list, the publisher added a dedicated real time optimization layer specifically for that inventory, a single script tag added without any change to the existing primary network relationship.
Remnant fill rate moved from roughly 30% to the mid 80s within the first couple of weeks, since real time, per impression evaluation was able to capture demand that a static, historically ranked waterfall simply never gave a fair chance to compete.
Month 3: Demand Partner Diversification
With placement and remnant inventory addressed, the publisher reviewed fill rate and CPM by traffic segment and found a meaningful gap in international traffic, roughly 20% of total pageviews, that their primary network had limited coverage for. Adding an additional demand source with stronger coverage in that segment closed a gap that blended reporting had been masking.
Result After Three Months
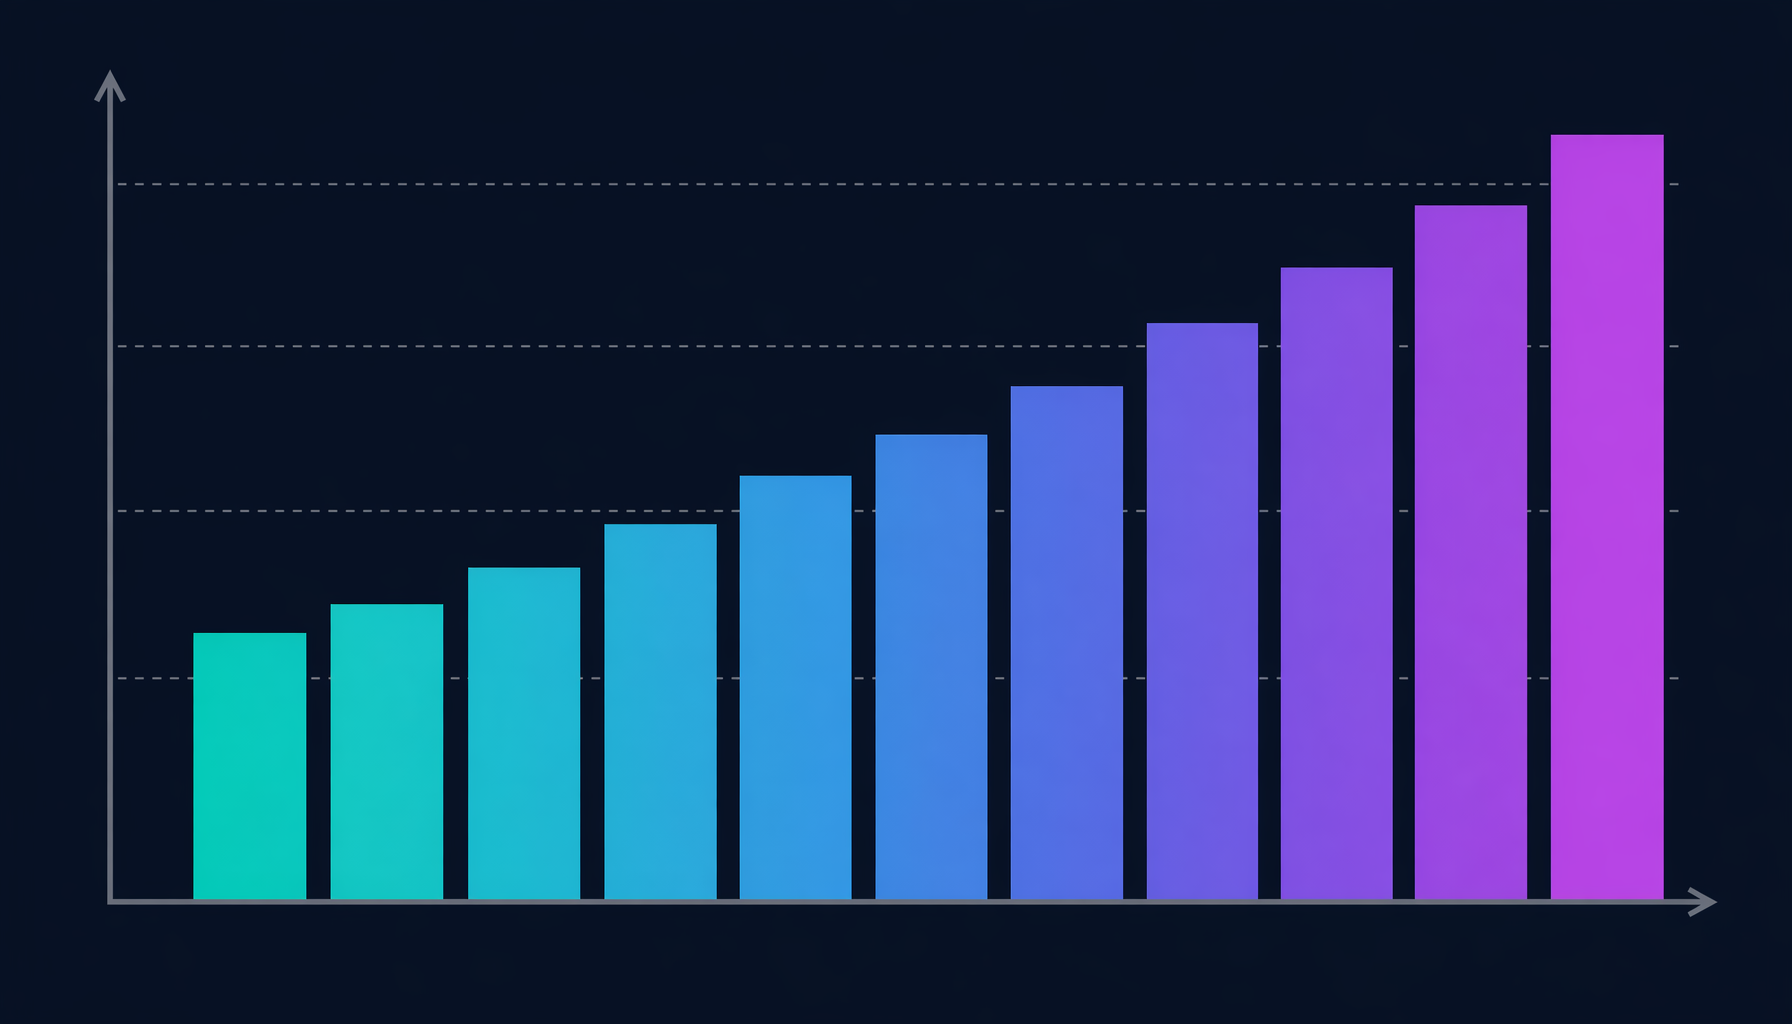
By the end of the third month, total ad revenue had roughly doubled relative to the starting point, without any meaningful change in overall traffic volume. The breakdown of where that lift came from is a useful illustration of how these levers typically compound:
- Roughly a fifth of the total lift came from placement and configuration fixes
- The largest single contribution, over half of the total lift, came from fixing remnant inventory specifically
- The remainder came from demand partner diversification addressing the international traffic gap
Why Remnant Inventory Was the Biggest Lever
This pattern, remnant inventory contributing the largest single share of a revenue turnaround, is common precisely because it tends to be the most neglected part of a typical publisher's stack. Primary inventory usually gets ongoing attention since it's the most visible, obviously monetized traffic. Remnant inventory, being what's left after primary demand passes, is easy to set up once and forget, which is exactly why it tends to hold the most upside when finally addressed properly.
What This Scenario Illustrates for Other Publishers
The specific numbers in any real situation will vary by traffic composition, content category, and starting configuration. But the general sequence, fix obvious configuration issues first, address remnant inventory as a dedicated layer, then diversify demand partner coverage based on actual segment data, is a reasonable, low risk order of operations for most publishers looking to grow revenue from existing traffic rather than assuming more visitors is the only lever available.
Frequently Asked Questions
Is this level of improvement typical for every publisher?
Results vary significantly based on starting configuration. Publishers with an already well optimized stack will see a smaller relative lift than one starting from a largely unaddressed remnant layer, as in this scenario.
How long does it typically take to see results from fixing remnant inventory specifically?
In scenarios like this one, meaningful fill rate improvement on remnant inventory is often visible within one to two weeks of adding a dedicated real time layer, since it doesn't require rebuilding the existing primary stack.
Should I fix remnant inventory before or after diversifying demand partners?
Generally, addressing remnant inventory first tends to produce faster, higher leverage results, since it's usually a single tag addition rather than a broader partner integration process, and it directly targets inventory that's currently earning close to nothing.
Key Takeaways
- Revenue plateaus are often a monetization configuration problem rather than a traffic problem.
- Remnant inventory frequently represents the largest single opportunity in a full revenue audit, precisely because it's commonly neglected.
- A reasonable order of operations is placement and configuration fixes first, remnant inventory next, then demand partner diversification based on segment data.